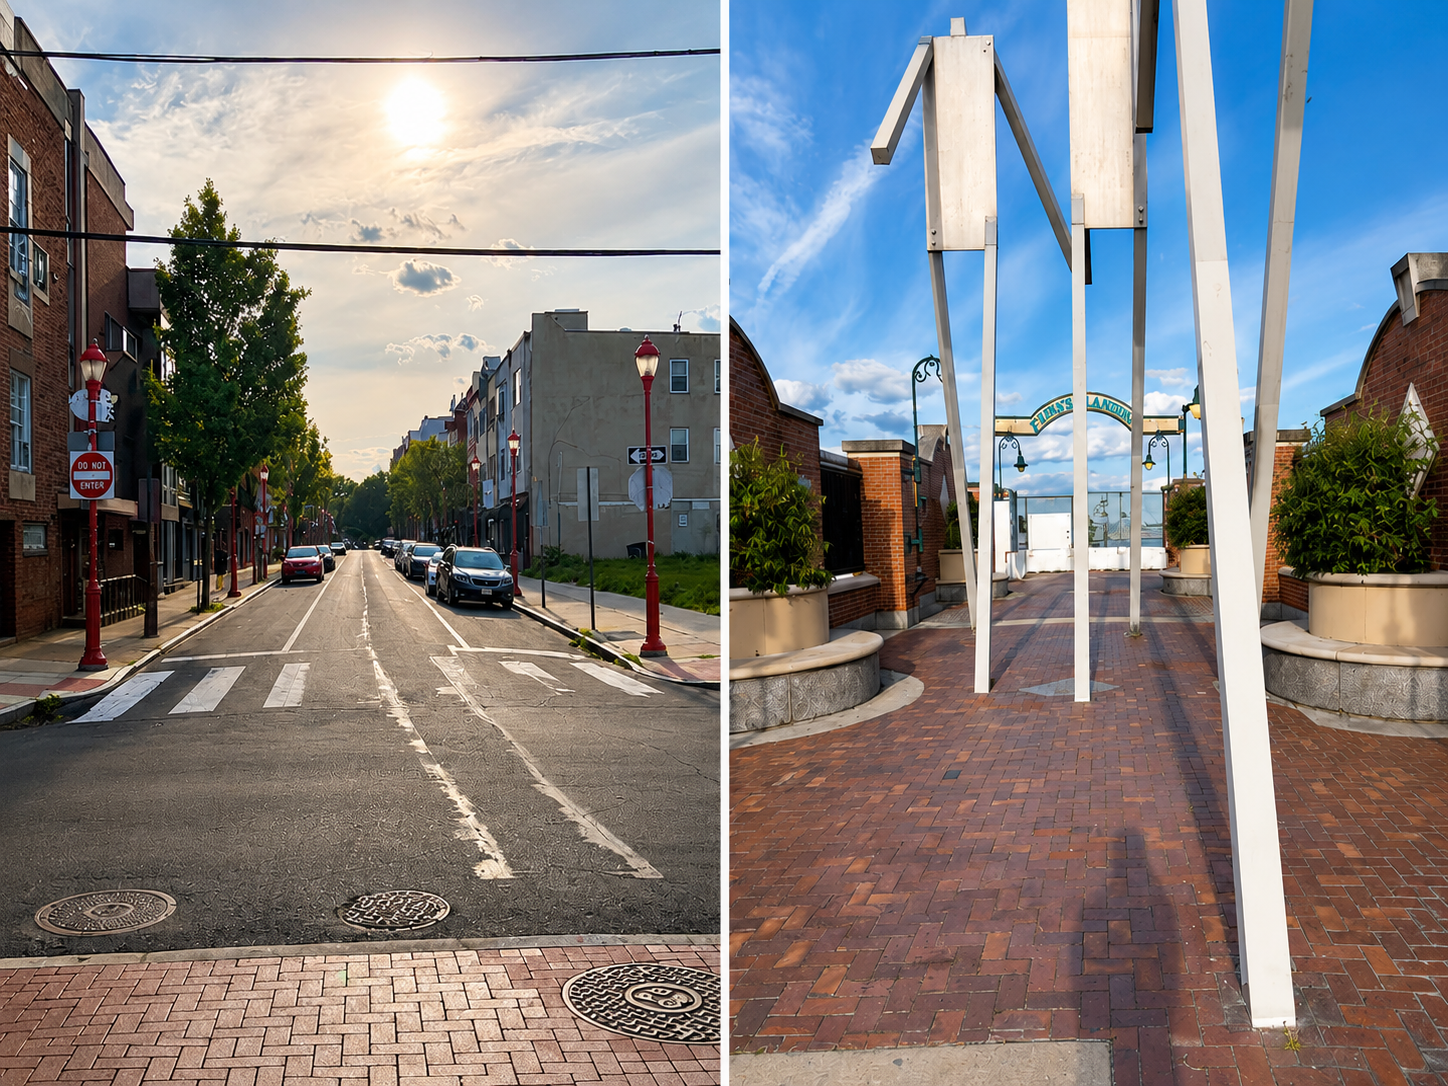
Summary
Saving South Street
A Four-Part Strategy to Restabilize a Historic Cultural Corridor
This study examines why South Street, one of Philadelphia's most recognizable cultural corridors, is declining despite the strong residential market around it. It is based on a 2026 parcel-level field survey of South Street and East Passyunk Avenue, stakeholder interviews, historical analysis, and Census demographic comparisons. The goal is to identify what is structurally holding South Street back and what policy package could restabilize it without erasing its cultural identity.
519 parcels surveyed 17 stakeholder interviews 2 corridors compared
01 The paradox
The Neighborhood Commercial Corridor Paradox
Decline amid residential strength. Commercial vacancy stands at a 30-year high even as the surrounding neighborhoods have gained population, spending power, and home value.
South Street and East Passyunk from the 2026 field survey; Center City from Center City District, spring 2026.
02 History
Cyclical Reinvention and Cultural Decline
South Street has reinvented itself roughly once a generation; its defining cultural economy has now thinned to a handful of legacy anchors.
The cultural economy, 1985 and 2025
03 The doom loop
The Economic Doom Loop
A self-reinforcing cycle in which vacancy depresses foot traffic, weak foot traffic depresses leasing demand, and weak leasing demand forecloses reinvestment.
The cycle returns to rising vacancy, and repeats.
Unlike earlier cycles, land demand remains high, so owners can hold appreciating parcels even as storefronts sit empty.
04 Diagnosis
Diagnosis: Three Structural Problems
The decline is structural, not a product of COVID, e-commerce, or weak neighborhood spending power.
South Street is not simply vacant; it is caught between the corridor it once was, the neighborhood it now serves, and institutions without the authority to remake it.
Governance gridlock
Fragmented authority across a BID and overlapping RCOs, with no entity empowered to coordinate a corridor reset.
Dormant real estate ownership
Long-vacant parcels held for land appreciation, decoupling rising land value from deteriorating buildings.
Declining pedestrian demand
South Street no longer has enough nearby residents or cultural anchors to support its amount of retail space. As housing supply tightens and destination venues close, the corridor depends on fewer daily users to sustain its storefronts.
05 The package
The Integrated Policy Package
A four-part strategy to restabilize the corridor; no single proposal is sufficient on its own.
06 The stakes
Two Failure Modes
Absent a coordinated intervention, the corridor faces two outcomes, and the window is narrowing.
Either the paradox widens until residents abandon the corridor, or residential conversion fills the vacancies and erases its cultural identity. The package is designed to balance reinvention with preservation.
Further reading
Read the full study
The complete analysis, methods, and citations are in the thesis and its companion pages.
Capital improvement project recommendation
The corridor's largest future opportunity sits at its eastern gateway: replacing aging, uninviting pedestrian infrastructure with a stronger connection between South Street's 100 block, its existing pedestrian bridge, and the new Delaware River bridge over Columbus Boulevard.