Findings
The Neighborhood Commercial Corridor Paradox
Twice since the 1960s, South Street fell and came back. This time the market's reset is broken.
A 2026 field survey of every storefront on South Street, from Front through the 1100 block, measured against East Passyunk Avenue from 1200 to Broad Street.
Executive summary
South Street's emptiness gets blamed on COVID and e-commerce. This study tests that with a 2026 field survey of every storefront on the corridor, measured against East Passyunk Avenue, a peer with the same pre-1900 building stock, the same density and transit, and a wealthier-than-average neighborhood. East Passyunk faced the same retail pressure and stayed full. South Street did not. The decline is structural to the corridor, not ambient to retail. The two corridors even share part of their customer base. Neighborhoods like Bella Vista sit between them, close enough that the same residents could reasonably shop either one.
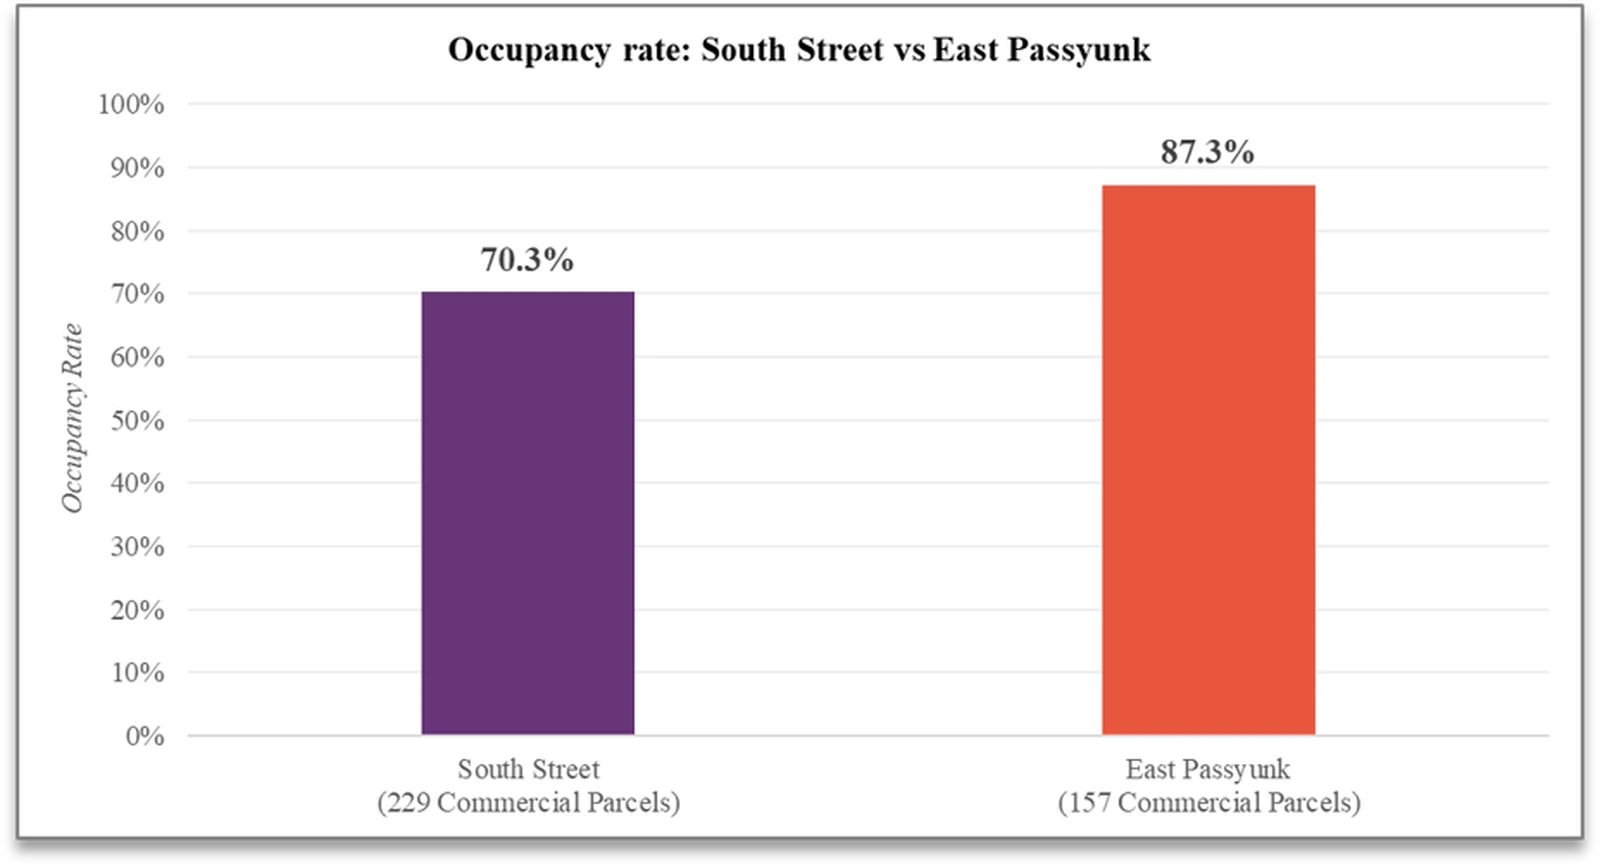
- The highest vacancy in over 30 years. South Street runs 70.3% occupied against East Passyunk's 87.3%, a 17-point gap, and its vacancy is the highest the corridor has seen in more than three decades.
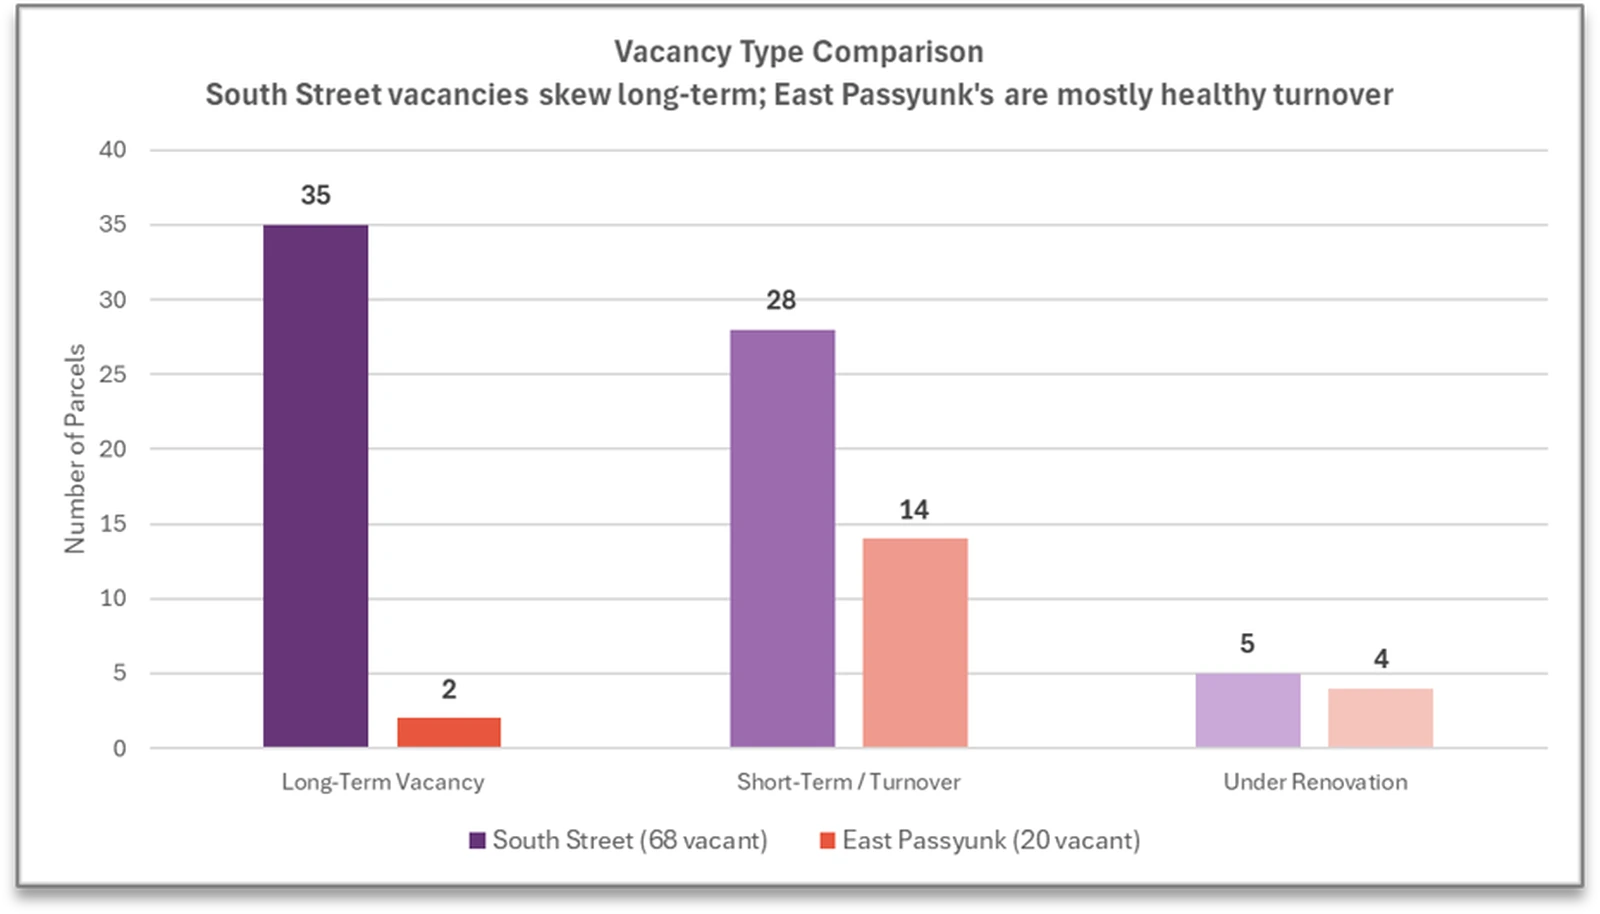
- Half the vacancy is long-term. Of 68 empty storefronts, 35 are long-term vacant, against just 2 on East Passyunk. The emptiness is stuck, not turning over.
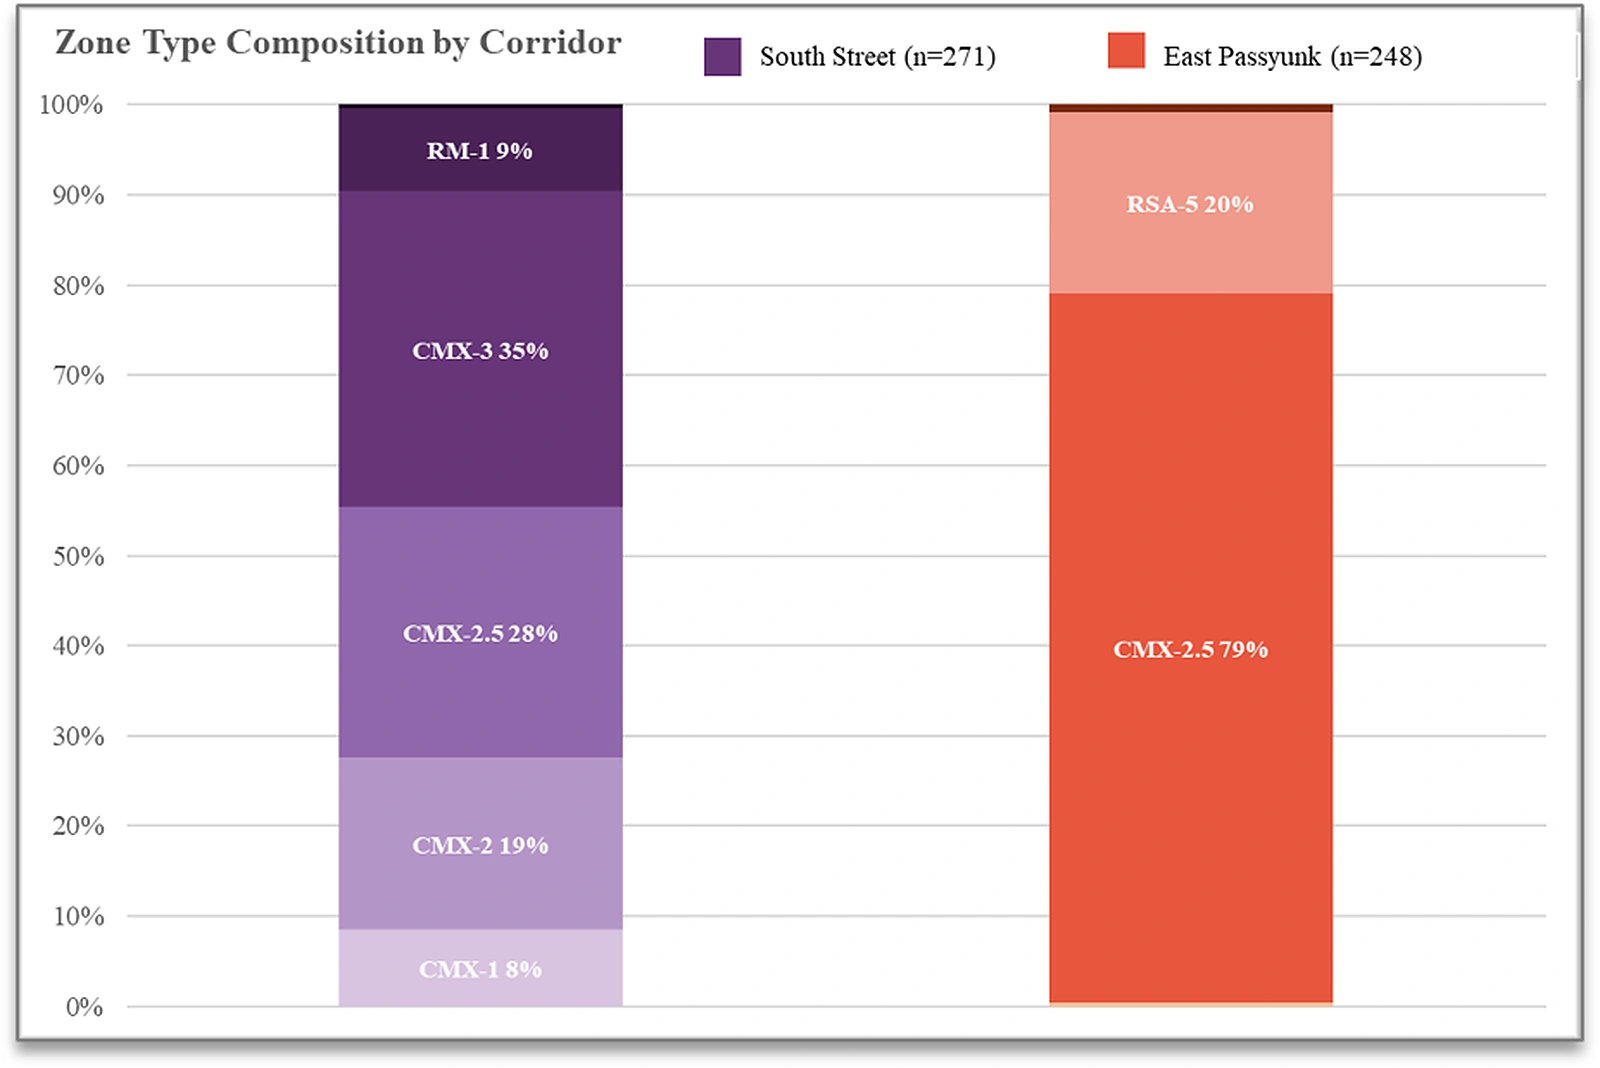
- A zoning patchwork. South Street splits across 5 registered community organizations and 4 CMX zoning classes, while East Passyunk runs through 2 RCOs on a single CMX designation, so the same use can be by-right at one address and need a variance a few doors down.
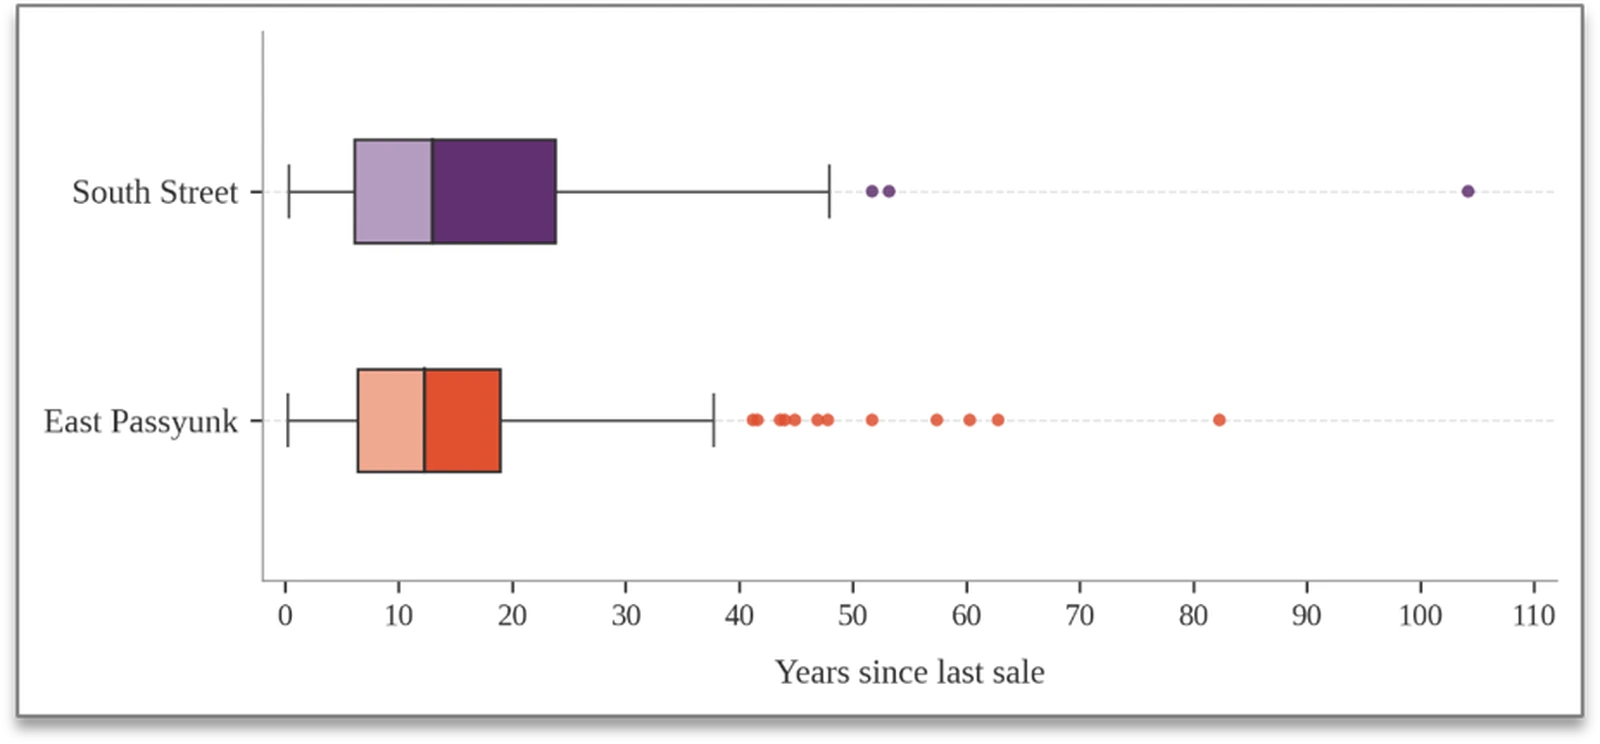
- 3 in 5 parcels sit with dormant owners. 155 of 271 parcels have either changed hands without a market sale or not sold in over 20 years.
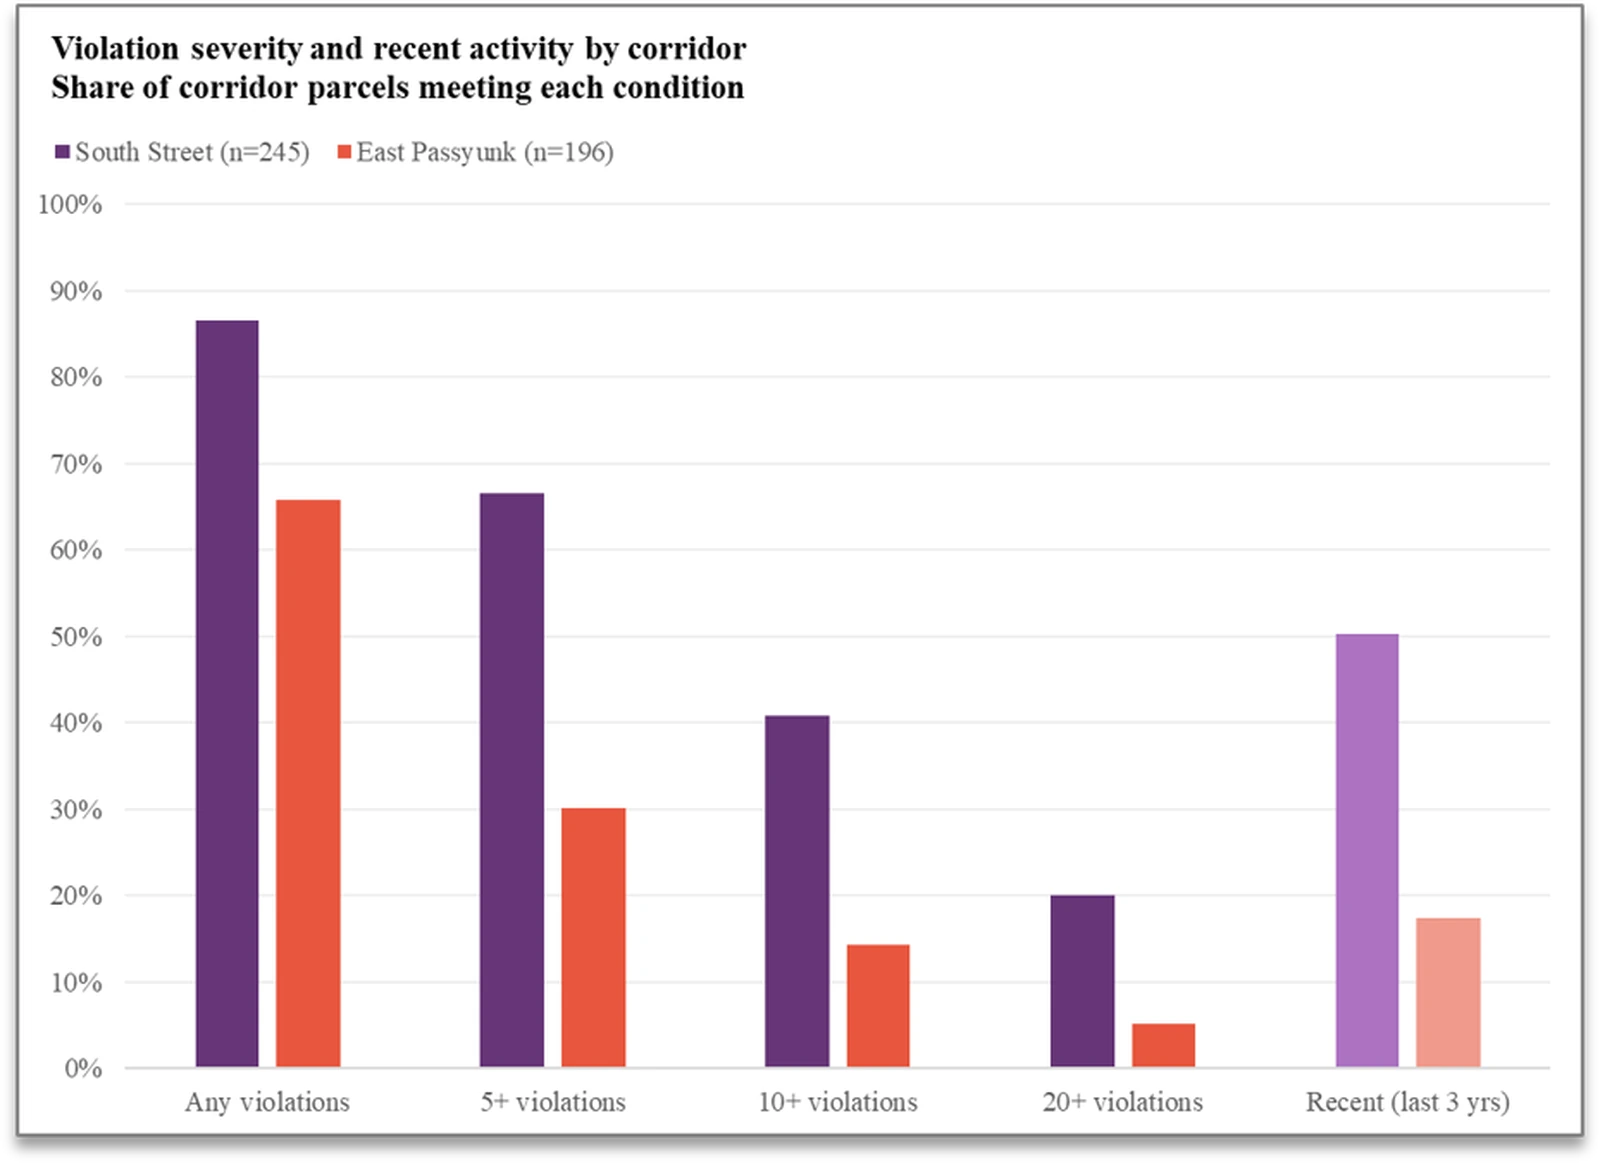
- Prices climb while the buildings rot. South Street land sells for about 1.8x East Passyunk's, a $273,000 premium. Even with no upkeep, the buildings keep appreciating on the strength of the surrounding neighborhoods, which gives owners little reason to reinvest. Half logged a new code violation in the last 3 years, 4x East Passyunk's count.
- The mix flipped, not the ownership. Both corridors are about 87% independent, so national chains killing the character is no longer the issue. South Street skews value-priced, late-night, and takeout, with smoke shops and check-cashers at 9.4% of tenants versus zero, and it runs thin on daytime, fitness, and fresh-food uses.
- The culture economy hollowed out. The corridor that ran on live music, comedy, and galleries is down to one surviving venue, the TLA. The Laff House, where Kevin Hart and Bill Burr started, closed in 2013 with no comedy club since, and a third of the corridor's anchor parcels, several of them former venues, sit empty.
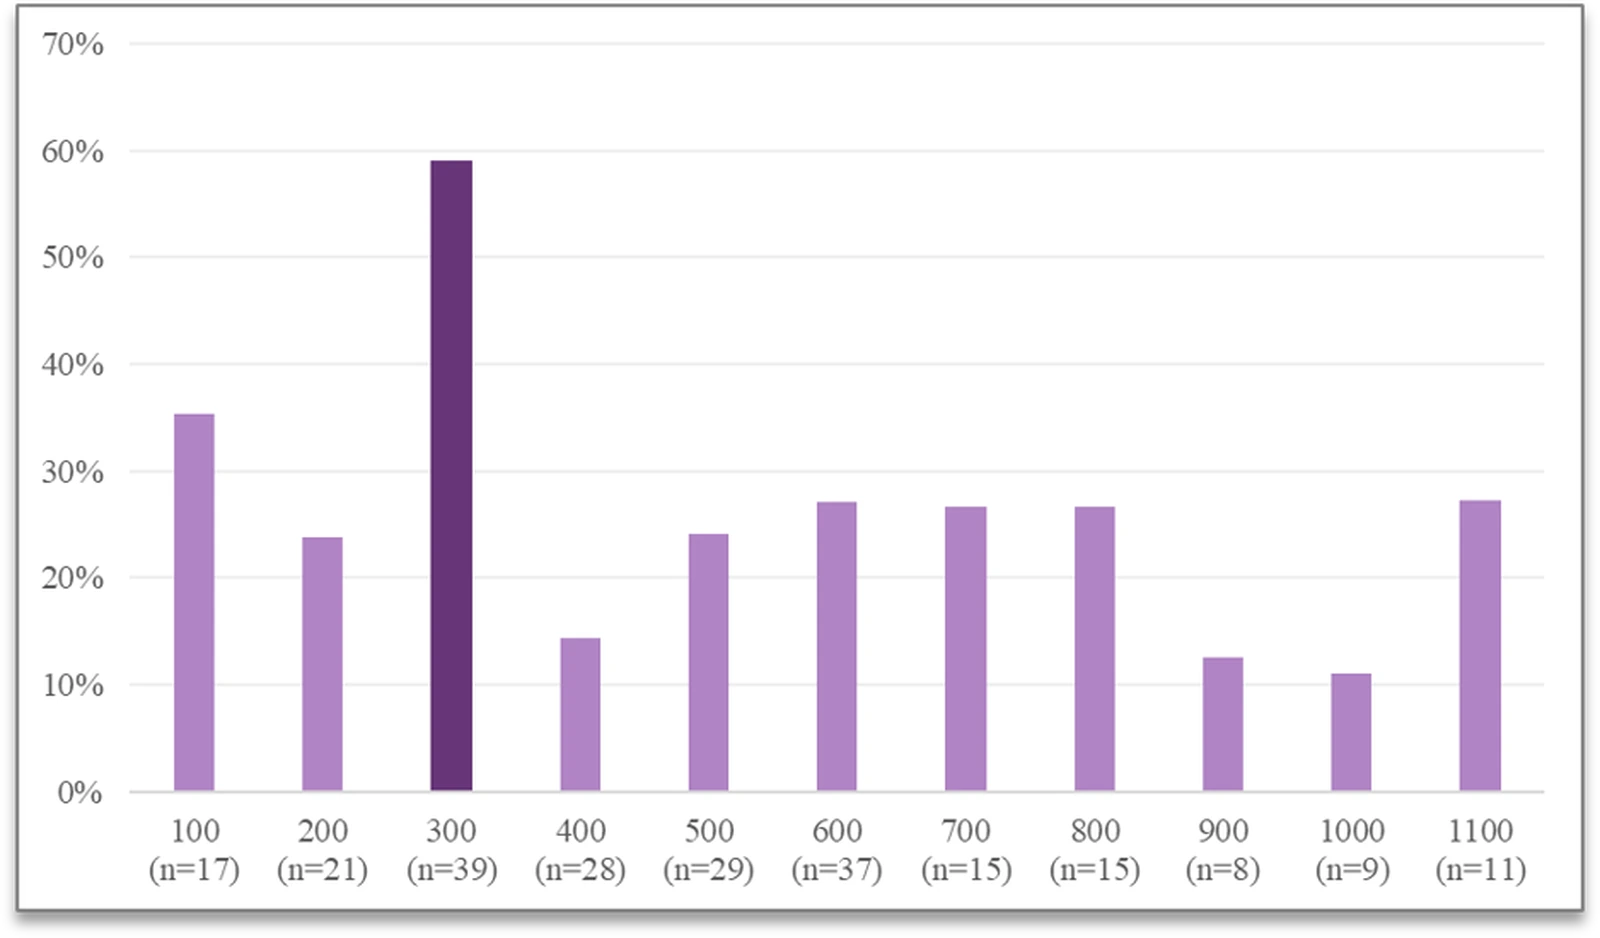
- The damage concentrates on a few blocks. The Front-to-5th dead zone carries the worst of it. The 300 block alone is 59% vacant, while the western 900 and 1000 blocks outperform East Passyunk.
The argument
South Street has run on roughly 30-year cycles, falling and recovering twice since 1965. Each recovery was set off from outside: the fight against the Crosstown Expressway in the 1960s, then the residential return and development wave of the 1980s and 90s. This downturn is different. Vacancy has reached crisis levels comparable to the Crosstown era, but today that distress sits alongside rising property values. Long-term owners have little reason to sell, cut rents, or reinvest, and the small businesses that would refill the corridor cannot absorb the cost of reopening aging spaces. The market's reset mechanism is broken. Left alone, South Street stays frozen rather than renewing, which is the case for outside intervention.
Finding 1
Highest vacancy on South Street in over 30 years
a 17-point gap
South Street's commercial vacancy is the highest the corridor has seen in over 30 years.
South Street has moved through roughly 30-year cycles, falling and recovering twice since 1965 (traced on the History tab). What breaks the pattern this time is the company the vacancy keeps. In past downturns, falling values eventually pressured owners to sell or reinvest. Today the vacancy sits alongside rising land values, so that pressure never arrives.
East Passyunk sits on the same pre-1900 building stock, the same density, and the same transit, and it faced the same retail pressure. It stayed full. South Street did not.
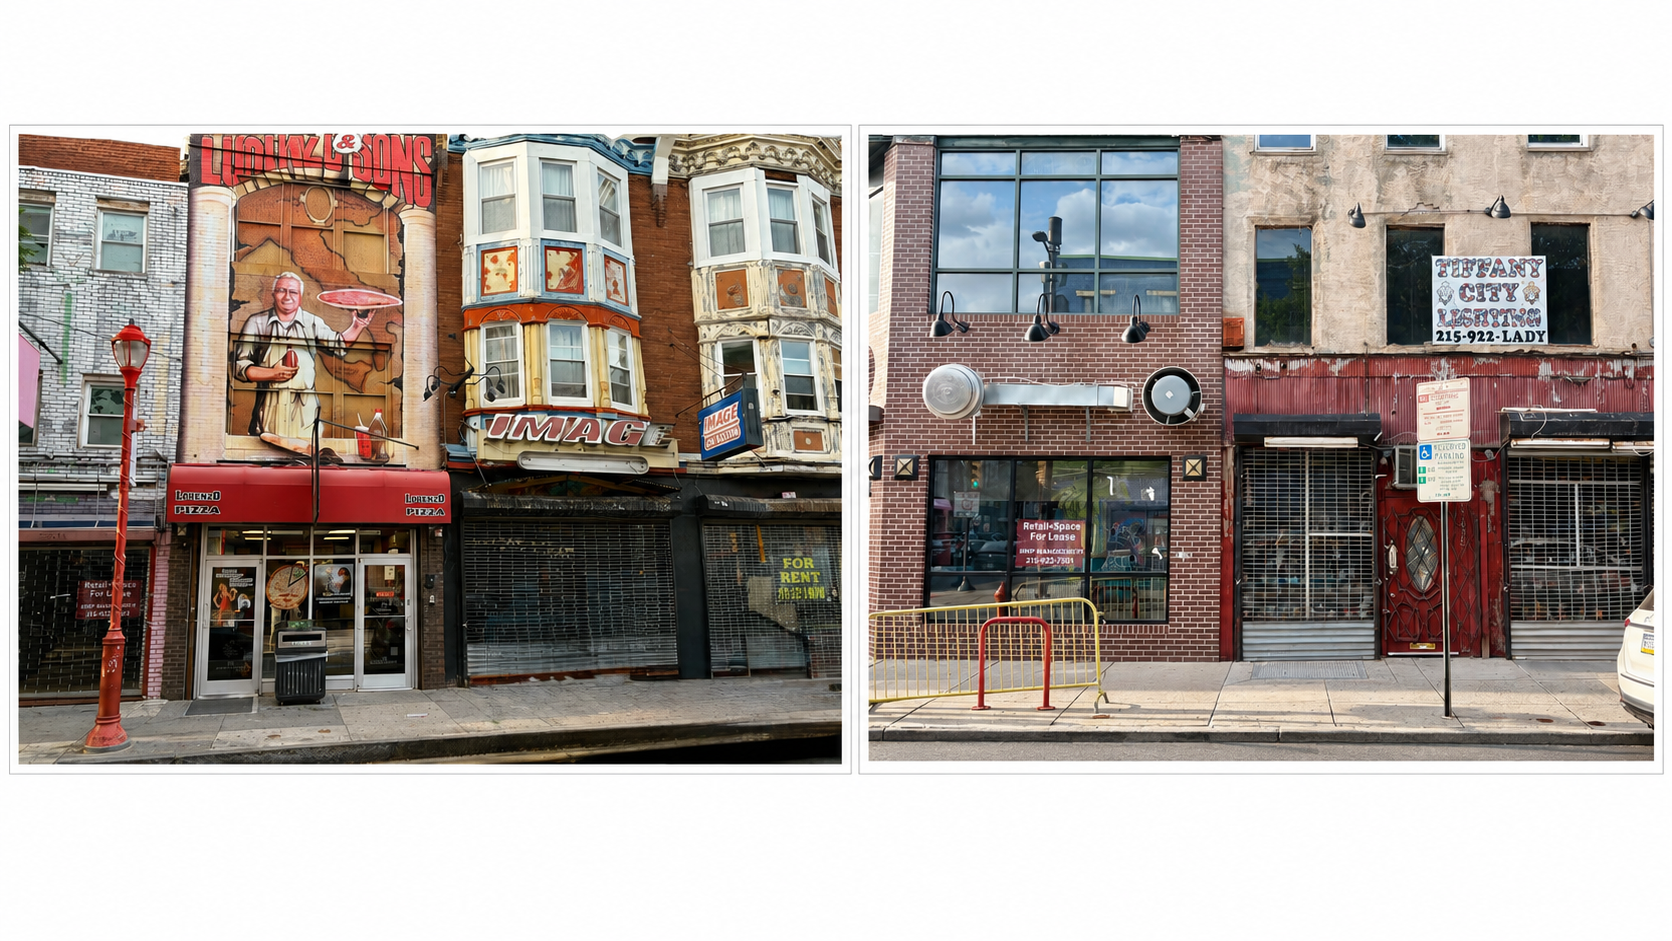
South Street is a shell of its former self.
Corridor stakeholder, 2026 interviews
The headline is the 17-point gap. The deeper finding is the composition of that vacancy, and it is the more important of the two. South Street has 68 vacant storefronts and 35 of them are long-term vacant. East Passyunk has 20 vacant and only 2 are long-term. Half of South Street's vacancy is sitting still.
A storefront counts as long-term vacant when it shows no for-rent signage, no posted permits, no construction visible through the windows, and visible signs of accumulated neglect like rotted trim, leaks, layered trash, and graffiti that has faded from age. In plainer terms, the test is whether the space could realistically appear on a commercial brokerage listing today. If it could not, it qualifies.
Finding 2
A zoning patchwork on one corridor
East Passyunk runs on 1 CMX class and 2 RCOs
From the sidewalk the two corridors look alike, brick row buildings 2 to 4 stories tall with retail below and apartments above. The difference shows up in the zoning. East Passyunk's architectural evenness mirrors its single designation.
South Street's CMX patchwork sorts geographically like a field goal post. CMX-3 and CMX-2.5 cluster on the eastern blocks between 2nd and 5th and the western blocks between 9th and 11th, while the middle runs lighter on CMX-1 and CMX-2 with residential pockets on the 100, 700, and 800 blocks. The net result is 3 distinct districts embedded within an 11-block corridor.
A tenant looking at two storefronts a few doors apart can find one that permits the business by-right and another that routes the same use through the Zoning Board for a variance. That friction shapes what can open where.
Each RCO receives notice of any zoning variance or special exception in its area and can object, so 5 RCOs means more meetings and more veto points for any change, where East Passyunk has 2.
Finding 3
Dormant ownership and the land-value decoupling
3 in 5 parcels held by dormant owners
A commercial parcel carries two kinds of value, the land underneath and the building on top. When ownership is engaged, operating the storefront, collecting rent, and maintaining the asset, both kinds of value rise together. When ownership is dormant, holding for land appreciation rather than operating income, the two decouple. The land keeps appreciating on location and redevelopment potential. The building deteriorates because no one is maintaining it.
That decoupling is South Street's diagnosis. High parcel prices coexist with deteriorating buildings because the corridor's dormant owners profit from holding without operating, and still draw cashflow from the apartment units above.
The price floor comes from the neighbors. South Street runs between Society Hill and Queen Village, two of the highest-income residential neighborhoods in Philadelphia, and sits a 15-minute walk from Center City. Those neighborhoods price the corridor's land independently of how the commercial use performs, because a dormant storefront still sits on a parcel the residential market values highly. East Passyunk had no such price floor when PARC and its predecessor began assembling property, which let them acquire 10 parcels and tie rents to tenant sales. South Street never had a group buy the bricks. Its long holds belong to portfolio owners like Michael Axelrod, who began assembling parcels in 1985, and Midwood Investment & Development, which acquired 11 of them in 2016. Together they control more than 40 addresses, concentrated on the eastern blocks where vacancy runs heaviest.
Finding 4
The hidden cost of long-term vacancy
4x East Passyunk's rate
This is the building half of the land-value decoupling. The deterioration is happening in motion, while prices stay high. South Street's violation profile exceeds East Passyunk's at every threshold, and 16.2% of its parcels carry open violations today.
Long-term vacancy and decay open an economic gap that neither side has a reason to close. The owner is not incentivized to fix the building, because the parcel keeps appreciating regardless. The commercial tenant who would take the space cannot afford the cost of making it usable. That is a market failure, and it sits at the center of South Street's vacancy.
We no longer send people interested in the area to South Street itself. The capital needed for the majority of the buildouts on the ground-floor level is just too costly, we're talking $100,000+. It's not reasonable for a small business to be able to afford that.
Director at a large commercial real estate brokerage, 2026 interviews
The programs built to close that gap mostly skip South Street. The city's larger fit-out tools, like the InStore Forgivable Loan of $50,000 to $100,000, flow only to corridors inside low-to-moderate income areas. That test looks at the blocks around the corridor, and South Street's neighbors in Society Hill, Queen Village, and Bella Vista post some of the highest incomes in the city, near $101,000. The corridor reads as affluent even though its storefronts sit empty, so it does not qualify.
Finding 5
The mix flipped, not the ownership
national chains are not the issue, the mix is what changed
Interviewees on both corridors voiced a common claim that South Street lost its character to national chains. The data does not bear that out. Both corridors are independent-dominated, with 86.2% of South Street's tenants and 87.9% of East Passyunk's operating as single-location independents. Independence is not the variable that diverged.
What diverged is the composition of that independent base. South Street is more than twice as concentrated in retail goods (41.3% vs 20.5%) and under-concentrated in the categories that anchor a daily-life corridor. Same shell, different commercial economy. Smoke shops and alternative financial services account for 9.4% of South Street's active tenants and zero of East Passyunk's. Its food and drink also leans takeout: 19 quick-service spots against 10 full-service, while East Passyunk runs the reverse at 25 full-service to 6 quick-service.
| Measure | South Street | East Passyunk |
|---|---|---|
| Retail goods | 41% | 21% |
| Professional services | 1% | 11% |
| Health and fitness | 6% | 8% |
| Grocery and fresh food | 3% | 5% |
| Takeout / quick-service restaurants (count) | 19 | 6 |
| Peaks late at night | 23% | under 1% |
| Smoke shops and check-cashers | 9% | 0% |
| Outdoor seating | 7% | 20% |
Source: Author's field survey, 2026. Active CMX tenants (South Street n=160; East Passyunk n=132).
Nearly 1 in 4 South Street tenants (23.1%) peaks during late-night hours, compared to less than 1% on East Passyunk, which concentrates 79.5% of its tenants in the afternoon and evening, the hours that serve a neighborhood. Sidewalk seating turns a visit into a stay: a diner at a sidewalk table holds the storefront for 90 minutes instead of 9. South Street's mix produces faster, in-and-out visits. The mid-day to early-evening economy is what is missing.
Finding 6
Vacancy is concentrated in the former cultural core
double the 30% corridor average
South Street's largest vacancy hole is concentrated in the former cultural heart of the corridor.
South Street's 30% corridor average is propped up almost entirely by the 300 block. Remove it and the remaining 10 blocks come in at 24%, 6 points lower. The 900 and 1000 blocks at 11.5% outperform East Passyunk's corridor-wide rate of 12.7%, which means the healthy end of South Street is healthier than the comparison corridor. The 300 block alone holds 14 of South Street's 35 long-term vacant parcels, 40% of the corridor's stuck inventory on a single block.
A ghost town.
Interviewee describing the Front-to-5th blocks
What the findings add up to
Taken together, these findings describe a corridor whose self-correction has stalled. Vacancy is at a 30-year high and half of it is long-term. The buildings decay while their land keeps appreciating, so owners have no reason to act. The tenants who would refill the corridor cannot afford the cost of entry, and the city programs built to help cannot reach an area this affluent on paper. That is a market failure, and markets in this state do not fix themselves. South Street's past recoveries were triggered from outside, and this one will need the same.
- The Policy Analysis tab lays out what that intervention looks like.
- Explore the survey on the Map tab, and download the datasets on the About page.
- The full chapter is in the thesis.